Connect with us

Hi, what are you looking for?

Stock

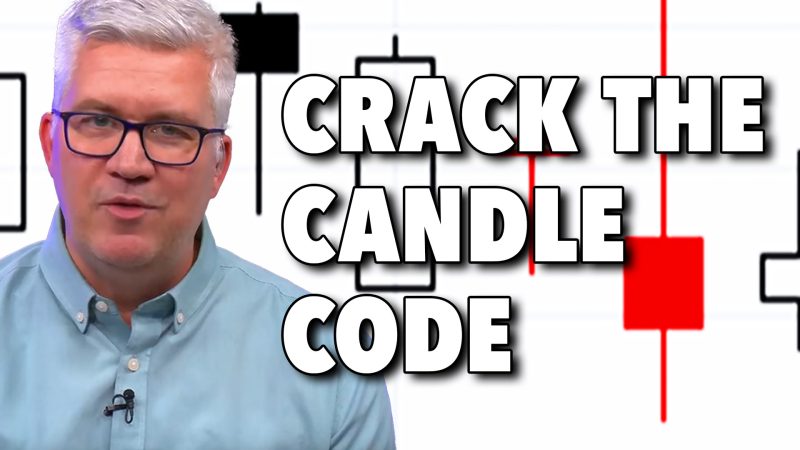
From Hammer to Harami: Using StockCharts to Crack the Candlestick Code

Join Dave as he reviews three common candle patterns traders can use to identify potential turning points. From bullish engulfing patterns to evening star patterns, Dave gives insights on how to leverage these powerful candle signals to anticipate market shifts. He also shows combining candle patterns with conventional technical analysis tools can help improve success rates.

This video originally premiered on July 14, 2025. Watch on StockCharts’ dedicated David Keller page!

Previously recorded videos from Dave are available at this link.

You May Also Like

World News

A suspected drunk driver going the wrong way on a highway in Milwaukee came close to Vice President Kamala Harris’s motorcade on Monday night,...

World News

In the final three weeks of the presidential race, former president Donald Trump and his advisers have attacked one particular foe more than three...

Stock

The S&P MidCap 400 SPDR (MDY) is trading at a moment of truth as its 5-day SMA returns to the 200-day SMA. A bearish...

World News

John F. Kelly, former president Donald Trump’s longest-serving White House chief of staff, said in a new interview that his former boss met the...

Disclaimer: hedgefrontier.com, its managers, its employees, and assigns (collectively “The Company”) do not make any guarantee or warranty about what is advertised above. Information provided by this website is for research purposes only and should not be considered as personalized financial advice. The Company is not affiliated with, nor does it receive compensation from, any specific security. The Company is not registered or licensed by any governing body in any jurisdiction to give investing advice or provide investment recommendation. Any investments recommended here should be taken into consideration only after consulting with your investment advisor and after reviewing the prospectus or financial statements of the company.